My Grafana dashboard was one single giant page with everything crammed in: server stats, Fritzbox, heating, power, PV - all in collapsed rows. It was annoying to navigate. So I spent an afternoon and split the thing into 5 specialized dashboards. Along the way I noticed that my heating's burner starts are suspiciously high, but that's a different story.
Dashboard Rework
The monolithic dashboard had gotten cluttered. Whenever I wanted to look up heating data I first had to expand 5 collapsed rows and scroll around. So I took an afternoon and split the whole thing into thematic dashboards.
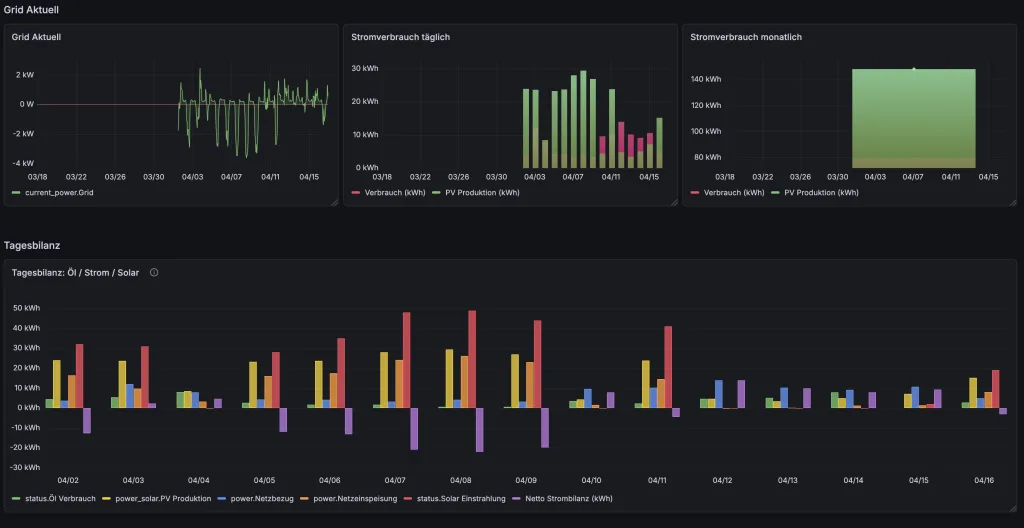
What came out of it are 5 dashboards: Vault Server with CPU, RAM, ZFS and disk I/O. Internet & Fritzbox with WAN throughput and WLAN clients. Heating with boiler, Zigbee thermometers and oil consumption. Power consumption with grid and daily balance. PV system with feed-in and string data. A few panels I cross-referenced, since power consumption is relevant in both the heating and the PV dashboard.
Grafana runs as a Docker container behind Traefik on grafana.malura.org. I scripted the rework through the Grafana HTTP API - created a service account token and uploaded the dashboard JSON via curl. Saves time when you're moving a lot of dashboards around.
ADS-B Wind Rose: Visualizing Reception Direction
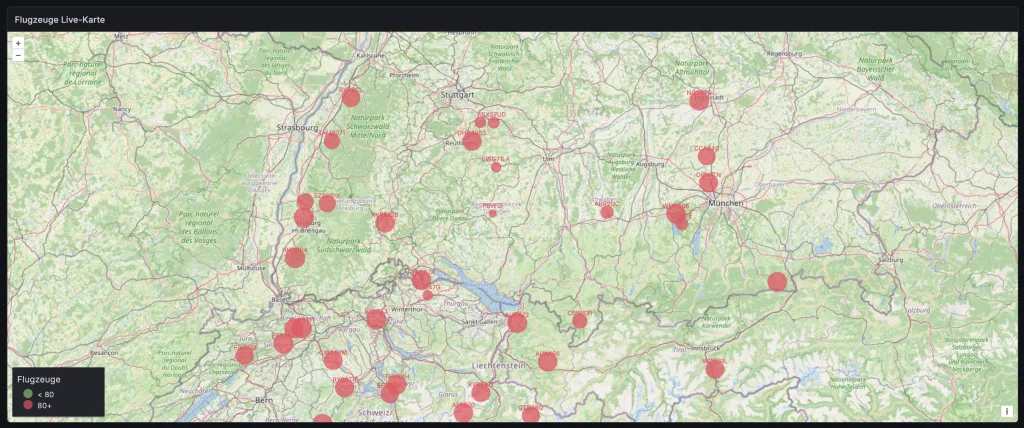
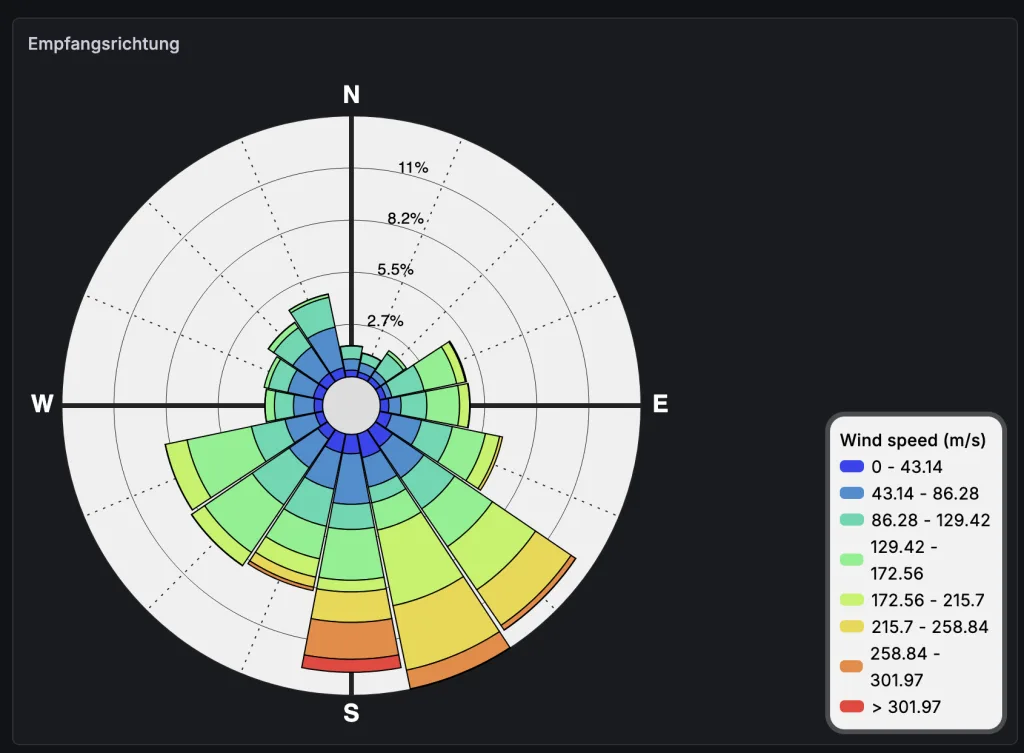
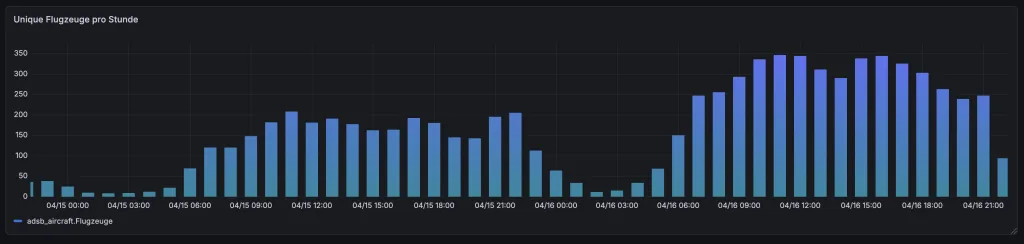
My ADS-B feeder has been running for a few days now and logs aircraft data into InfluxDB. The dashboard already had aircraft tracking, but I wanted to see which direction I receive the most signals from. The operato-windrose-panel plugin needs exactly the fields wind_direction and wind_speed. Annoyingly, the track field shows the flight heading, not the reception direction.
So I built the bearing calculation directly into my Python logger (adsb_influx.py):
from math import radians, degrees, atan2, sin, cos

def calculate_bearing(lat1, lon1, lat2, lon2):
    dLon = radians(lon2 - lon1)
    lat1, lat2 = radians(lat1), radians(lat2)

    x = sin(dLon) * cos(lat2)
    y = cos(lat1) * sin(lat2) - sin(lat1) * cos(lat2) * cos(dLon)

    bearing = degrees(atan2(x, y))
    return (bearing + 360) % 360

# Receiver-Position aus Config
receiver_lat, receiver_lon = MY_LAT, MY_LON

bearing = calculate_bearing(receiver_lat, receiver_lon, aircraft_lat, aircraft_lon)
New InfluxDB fields: bearing (0-360°) and distance_km. Query for the wind rose:
SELECT "bearing" AS "wind_direction", "distance_km" AS "wind_speed"
FROM "adsb_aircraft"
WHERE $timeFilter
Works. Most aircraft come in from the south-west.
Learnings: What Didn't Work
- Barchart panel type crashes in Grafana 13 with time series -> use
timeserieswithdrawStyle: "bars" - Plotly plugin (
ae3e-plotly-panel) has cryptic syntax -> native panels are more robust - Dynamic Text plugin crashes on Handlebars with umlauts -> use stat panels in a grid layout
filterByValuetransformation sometimes filtered out ALL the data -> split queries as an alternative
In the end I now have 5 dashboards instead of 1, ADS-B with a wind rose, and a couple of plugin disappointments. But everything runs cleanly through the API now and is reproducible.